Conversion of Point cloud to 2D drawing
It has been far too long since I last wrote a post. I had an idea of automating conversion of 3D scan point cloud data to 2D drawings in my head for a while but I have been focusing much on my professional work for the past few months and haven’t got the time to test it out. My writing might be a bit rusty,but one thing at a time.
3D scans and point-clouds are amazing. They could be very, sometimes even too, detailed and provide understanding of existing building far greater than topographical drawings and photos. However, it is somehow to difficult to convert to 2-dimensional vector drawings for overlaying and taking measurements. It should be noted that some point cloud preview software (ReCap) let you interact a bit with the model and output some 2D information in raster image formats (.jpg, .png) straight out of the box. However, the issues associated with this workflow are loss of accuracy when working with scaled images (especially at low resolutions), possibility of incorrect scaling due to human errors and clunckiness of some CAD software when images are imported. So images are an option but I am after something with more potential.

Fig.2 Point Cloud Preview 2

Fig.1 Point Cloud Preview 1
Solid models are fairly easy to be sliced in any direction with a plane and get linework suitable for laser-cutting, drawing ,etc. Point clouds on the other hand do not offer the luxury of being sliceable, but this was my starting point.
Connect the dots
Theoretically all that is required to produce plan is extract all points in a single plane (horizotal for plan or vertical for section) and connect the points. Easy right? Well, not really.
First thing to note is that point clouds could be very dense (more than 1 million vertices) so the total point count had to be reduced to make the model lighter and easier to work with. This was done using CloudCompare (Figures 1 and 2).
Once the model is optimised, it is then imported in Rhino and all the relevant points at about+1.5m from finished floor level (FFL) (for ground floor plan) are extracted (Fig.3) .
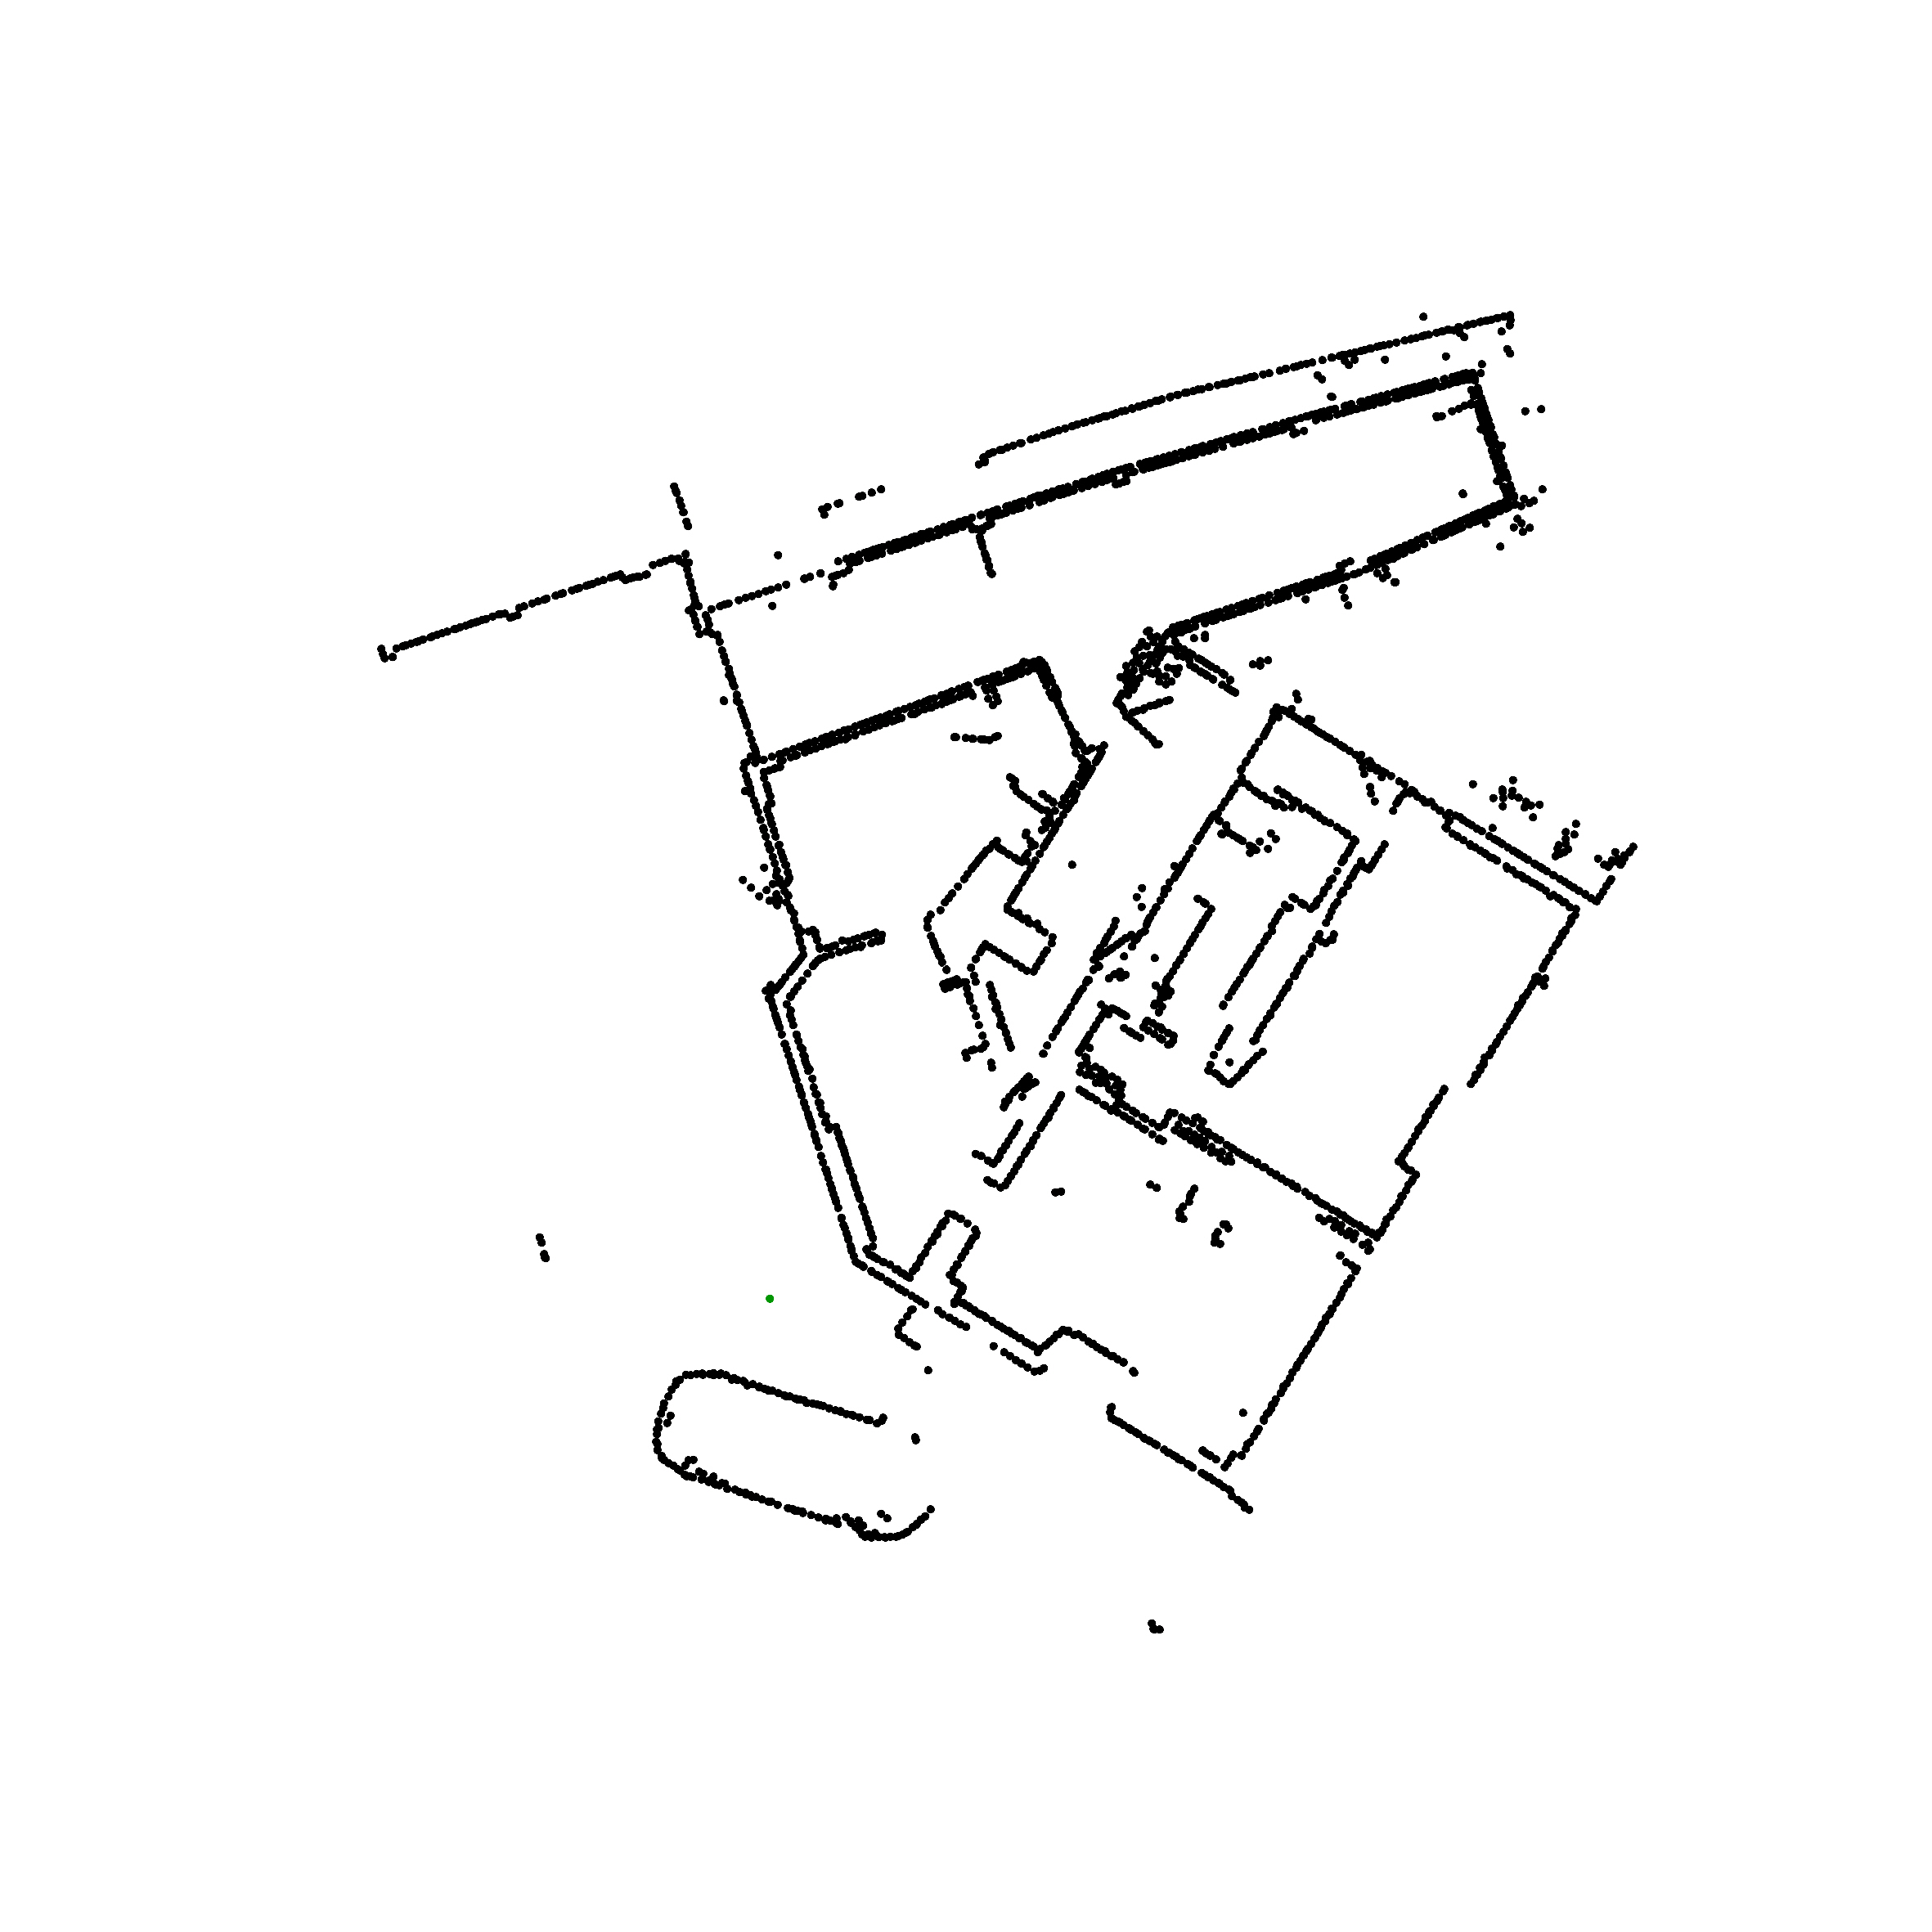
Fig.3 Points at +1.5m FFL
The principle for connecting the point is the same as in children’s books to make an image of an animal. Unfortunately, sorting the points in a correct connection order is very difficult as the point cloud information has very simple structure and it’s hard to formalise a general sorting rules that would not result in a birds nest looking image.
Scalar field
The second option is using a scalar field to produce approximate cad plan. This method is much more flexible and robust , however it does have some downsides which will be described later.
In mathematics ,scalar field associates a scalar value to every point in a space – possibly physical space. Scalar field can be constructed with minimum of 3 numeric values (two variables for X and Y coordinates and a third variable for scalar value). In this particular problem, the point cloud information can be used as a starting point for a scalar field generation which would then be transformed into CAD plan.
To start, we need to generate a blank field with grid of points to cover the area in interest. Next, the distance between the each grid point and its closest point in the survey cloud to return a list of proximity values (this could be done using ClosestPt component in Grasshopper).This is the fundamental part that would provide a scalar value.To turn the scalar field (Fig.4) into a plan only about the top 5% of grid points are needed for and an “approximate plan” to be returned by generating perimeter polyline (Fig.5).
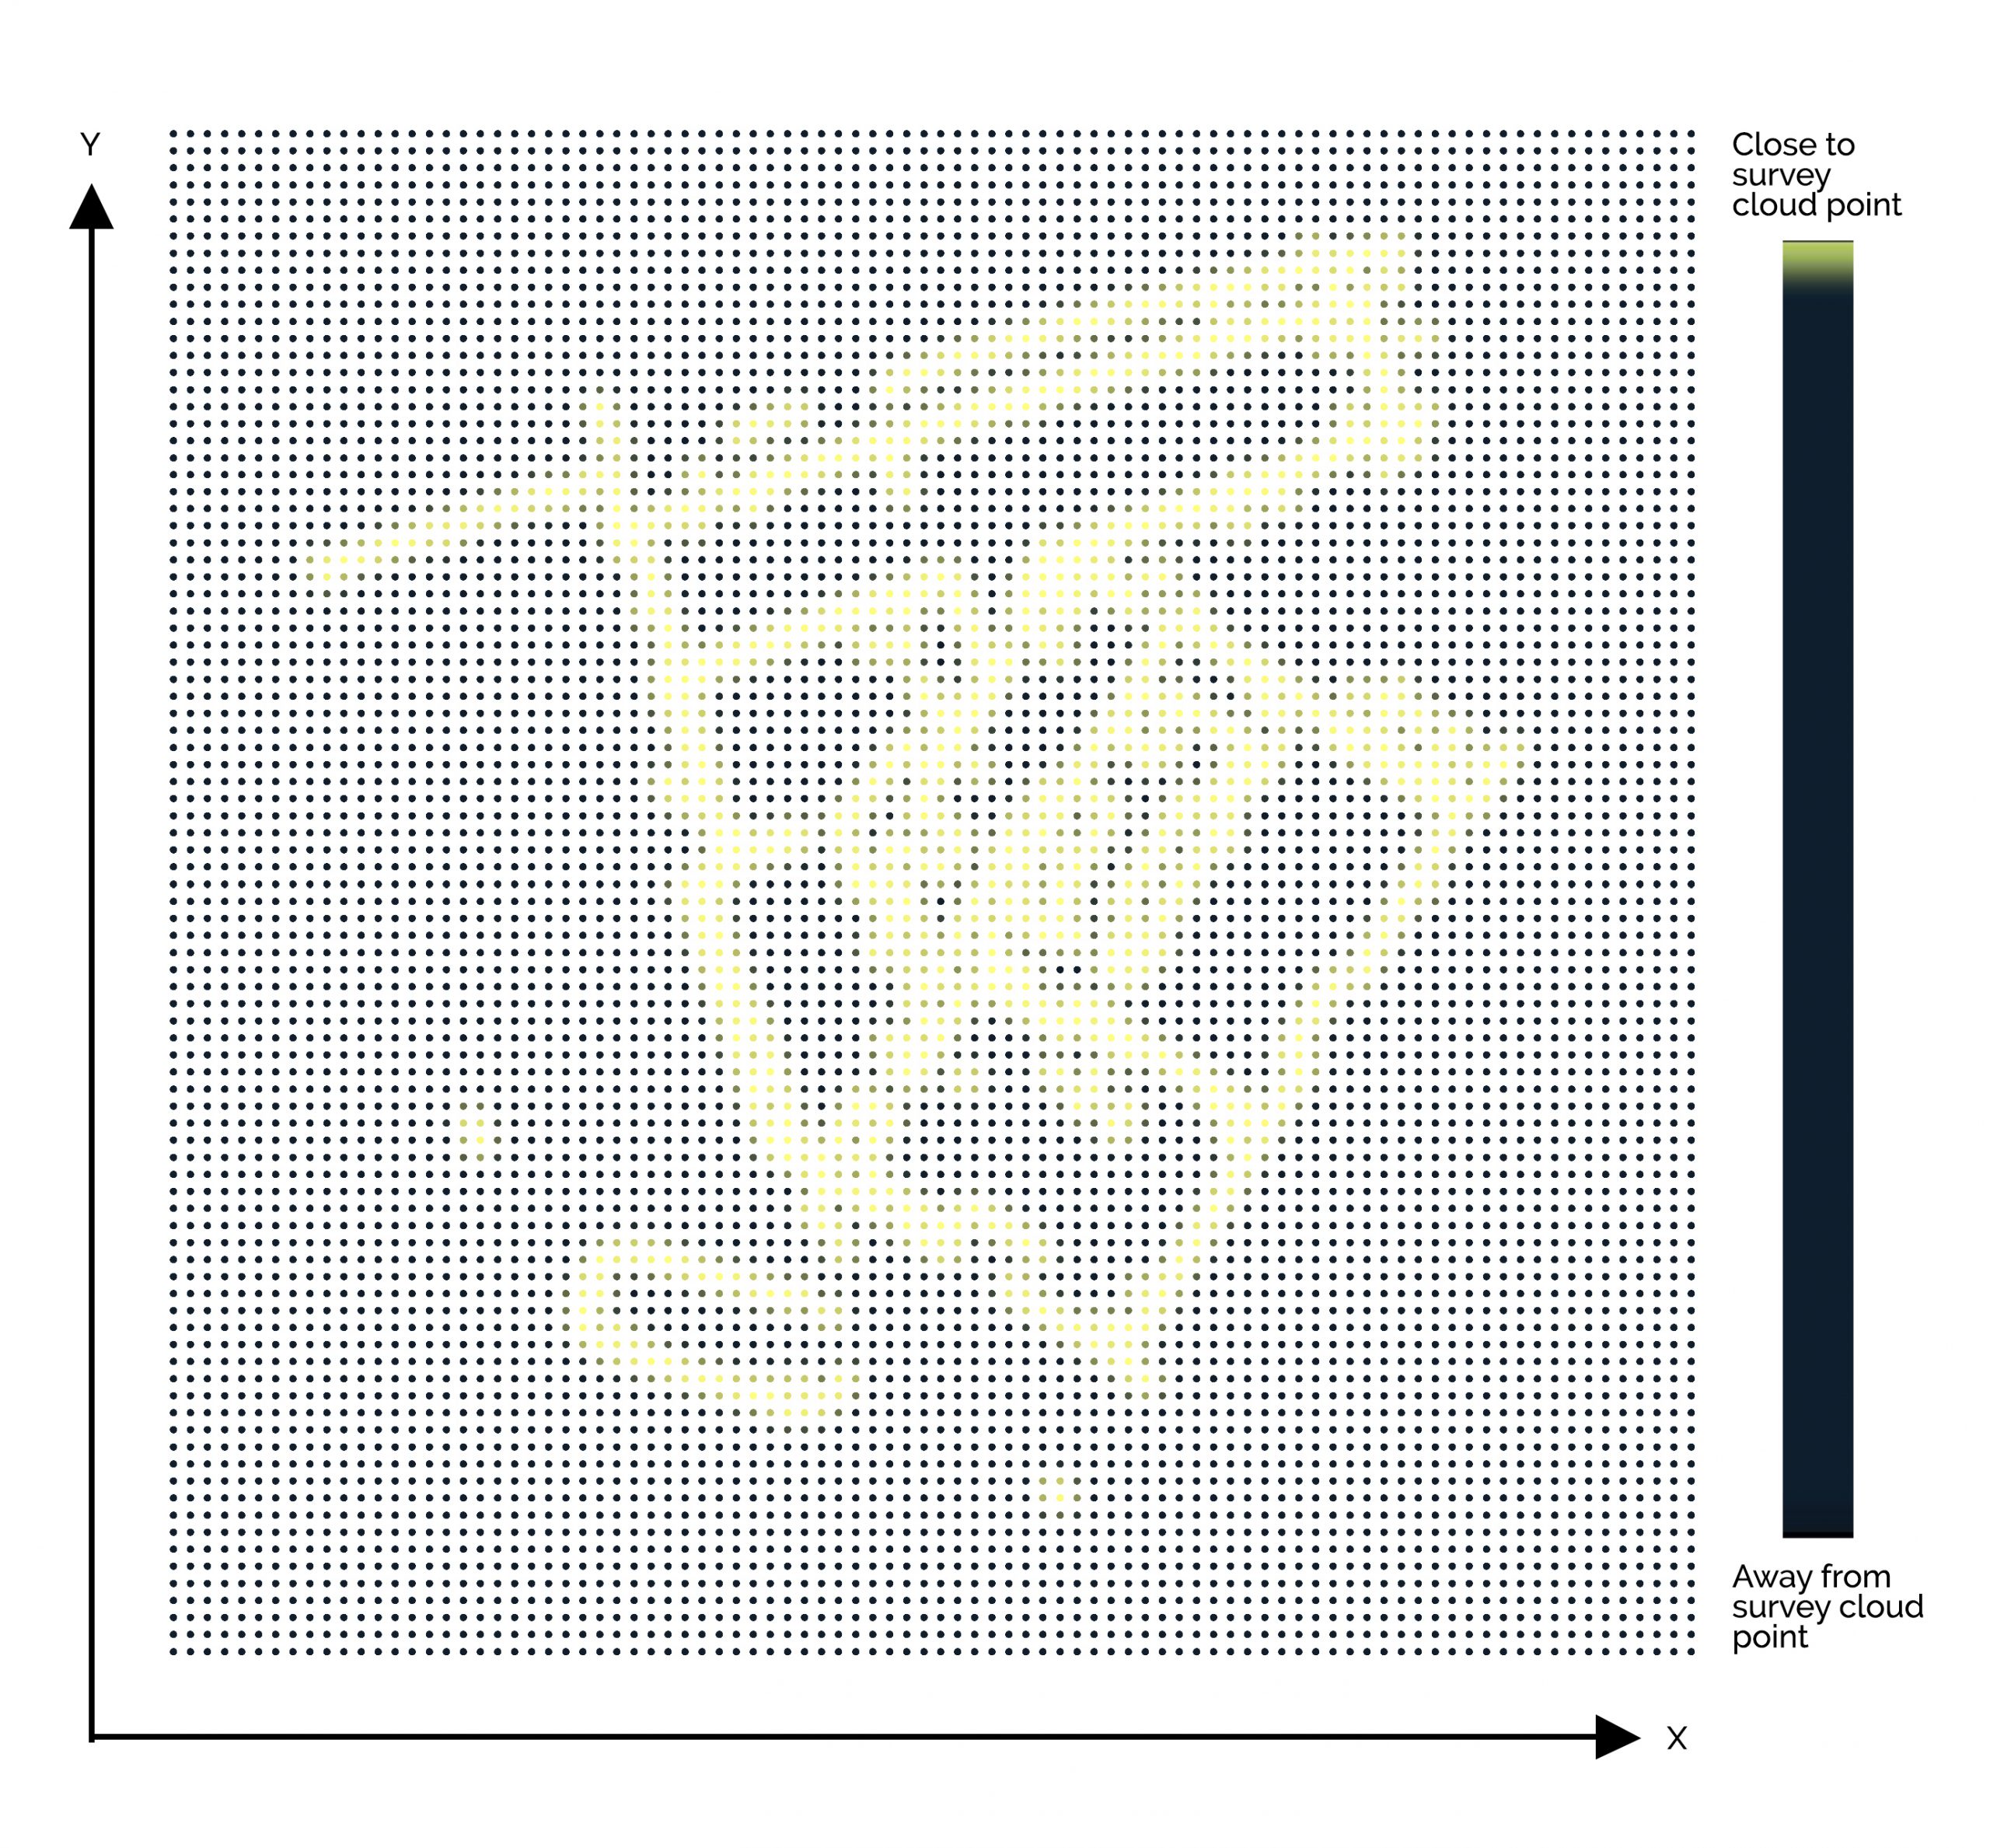
Fig.4 Scalar field
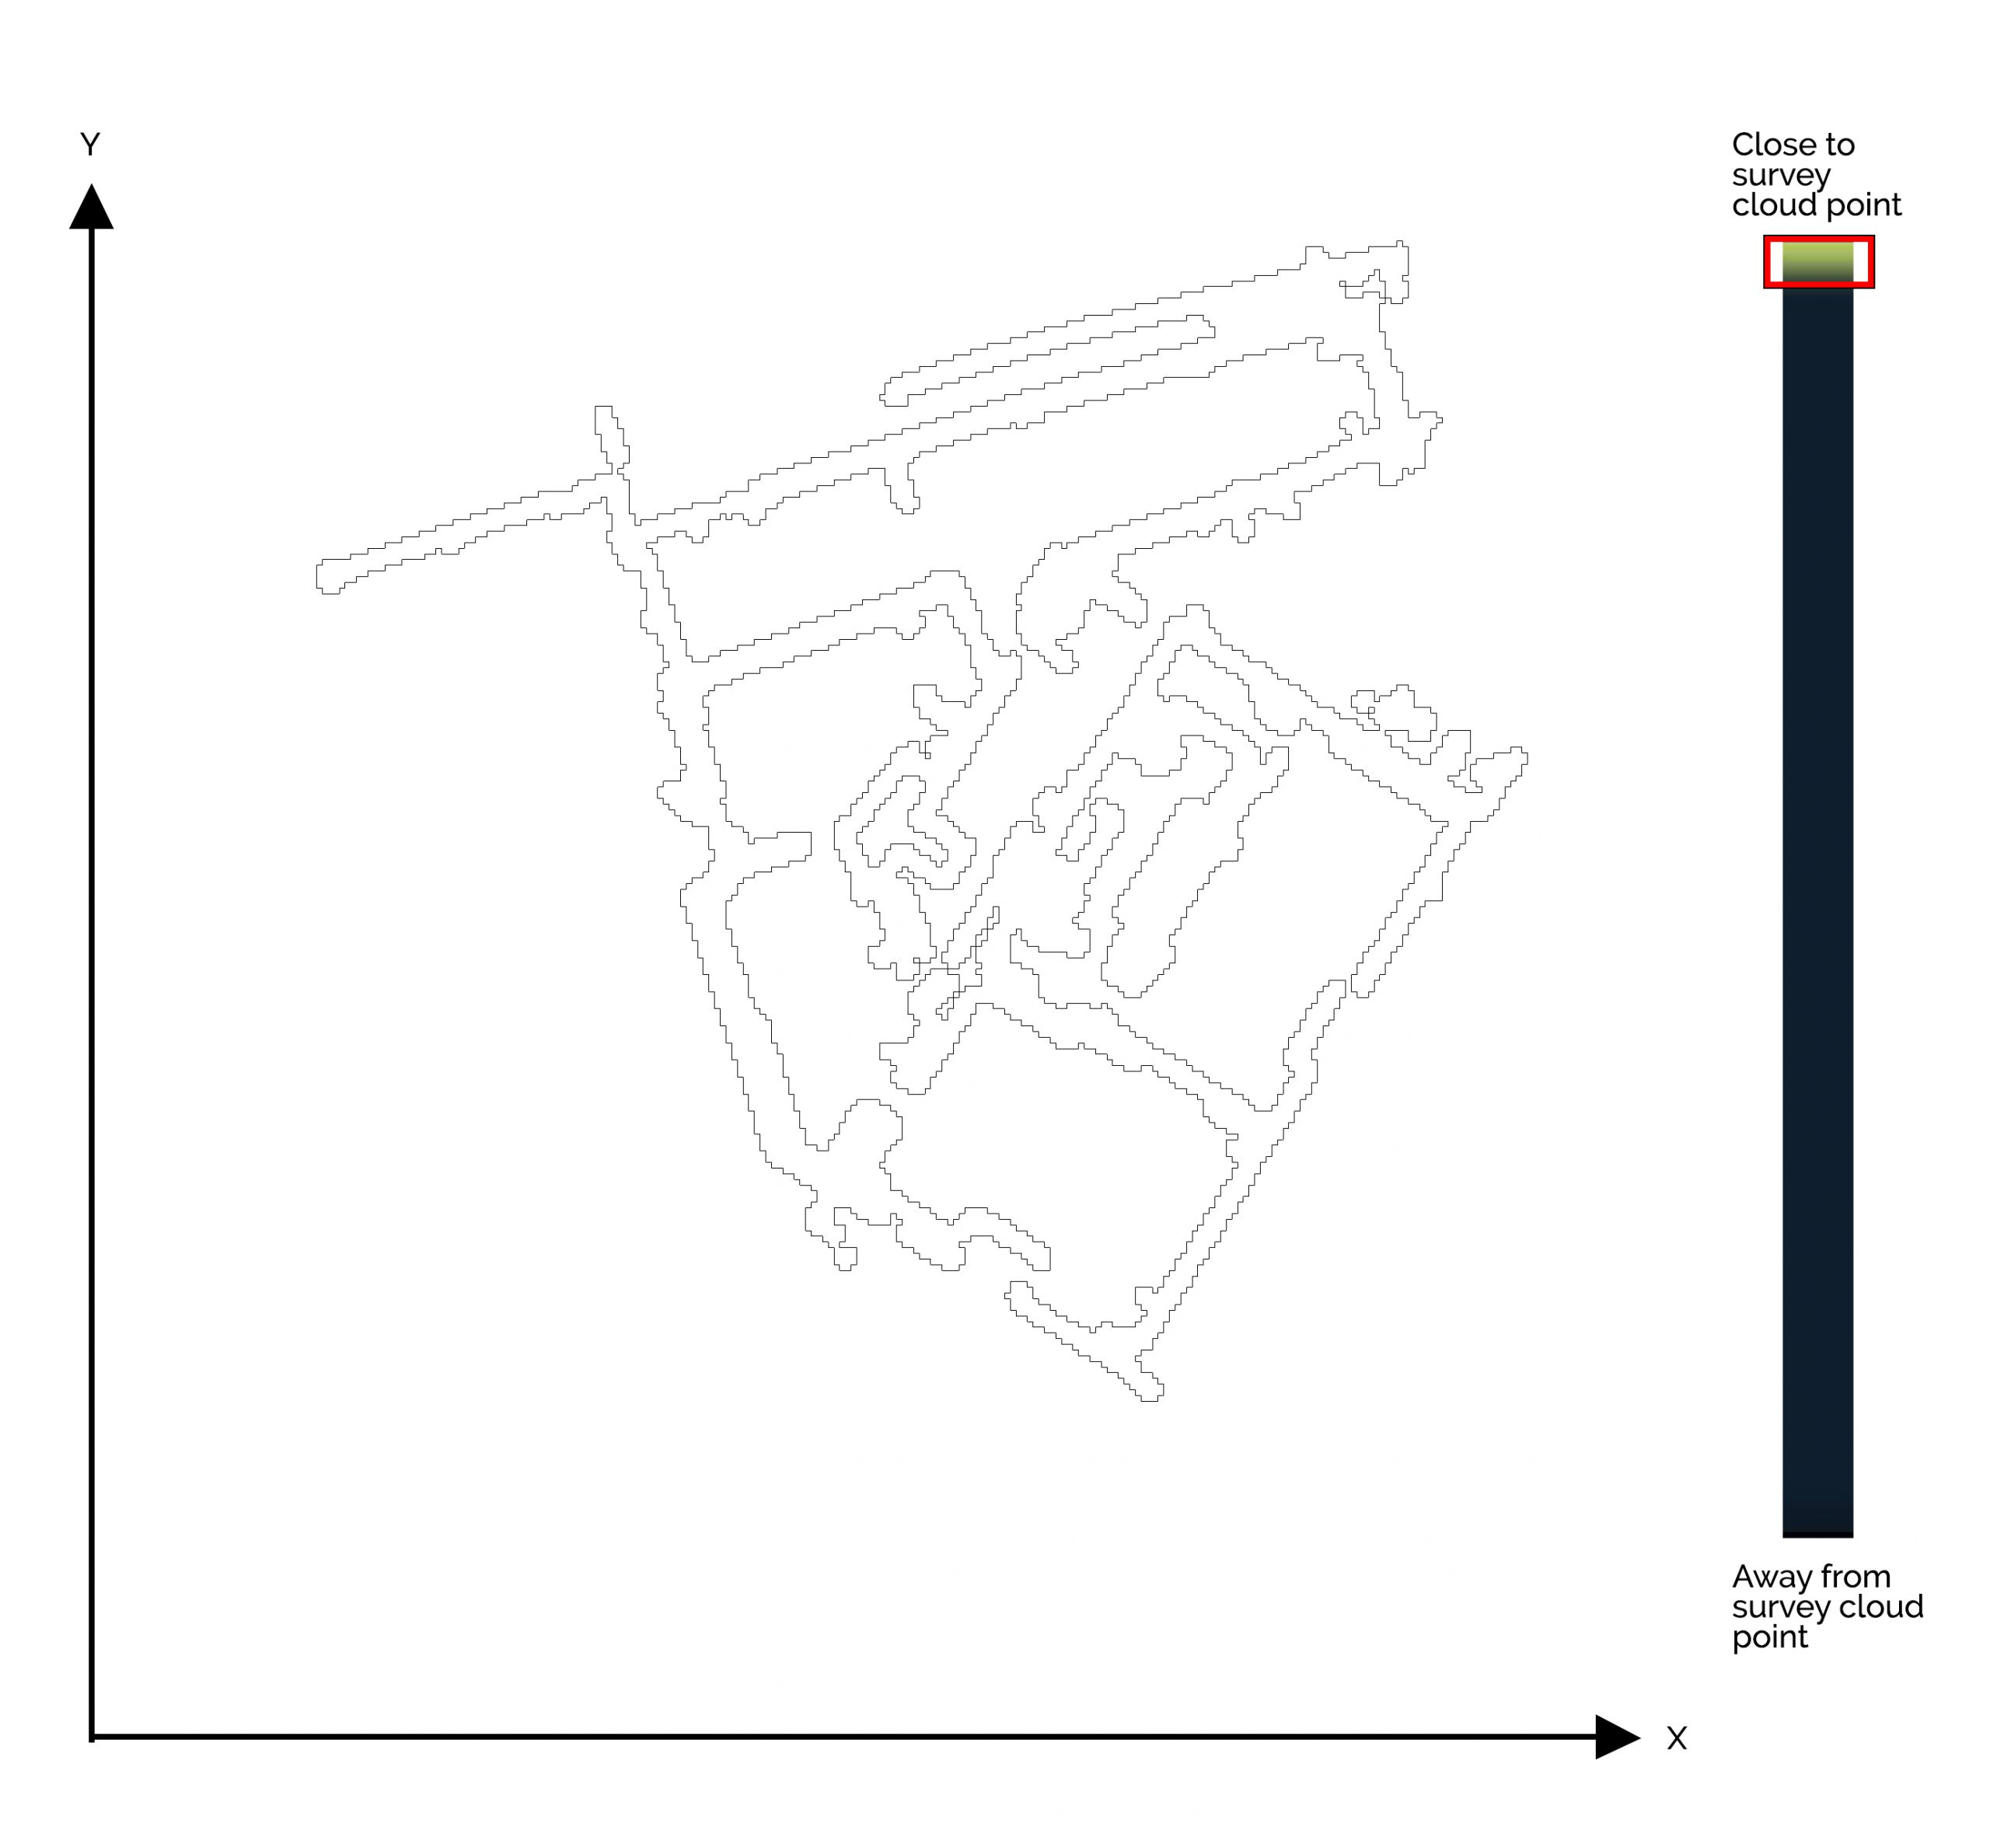
Fig.5 CAD plan polyline
Pushing the limits (supersampling)
It is obvious to note the approximate plan is no in any way an accurate orthographic drawing and this is due to resolution. Generally, resolution = accuracy = processing time, therefore increasing the resolution would provide more accurate drawing but also take much longer to processes so some trade-off should be considered at this stage. Unfortunately, most CAD software is bound to a single-thread so multi-core CPU would not provide significant improvements as only one core will be utilised. This is the first bottleneck that would need to be optimised in future. Examples to be added in the upcoming weeks.
Other issues
As discussed above increasing the resolution would result in increase in accuracy. For ultimate accuracy can only be achieved by using actual survey scan point cloud note for generation of the CAD plans so that would continue to be the explored in future in a hybrid scalar field and connect dots methods.
Further steps
Clustering is also another area to be explored in future as it promises grouping points that could be replaced with elements such as windows and doors if successful. More to come..
Fundamentals to clustering high-dimensional data (3D point clouds)
How to automate 3D point cloud segmentation and clustering with Python